Contingency Tables
Instead of Venn Diagrams, we can use contingency tables to show probabilities of combinations of events:
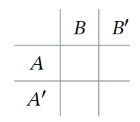
Here the upper-left entry is
Using the residential properties example, we have
| |
| ---- | --- | ---- | --- |
|
|
| | .8 | | |
Since
| |
| ---- | --- | ---- | --- |
|
|
| | .8 | .2 | 1.0 |
If you wanted to use the table to get say
and so on.
References
- [[Matthew A. Carlton, Jay L. Devore - Probability with STEM Applications-Wiley (2020).pdf#page=48]]