Lecture 2 - The Big Picture (literally)
Reminders
- Strike info will be sent out later down the pipeline
Real-Time Interactive Comp. Graphics Applications
Goal: My program draws something to the screen, and my program can possibly animate it. The user should be able to interact with the program.
This is a big goal! So we'll break it up. Our first goal is rasterization, making a rasterizer (project 1). This will be about drawing a single static picture. The code outline is:
Starting the Rasterizer
We are given an obj file, full of indexed face sets (see Lecture 1 - Syllabus and Starting Graphics). Recall that:
- Points are described by vertices (ie: singular vertex)
- We describe our data in our world space
- We need a way to map our 3D coordinates to our 2D pixel space.
- An easy way is to set all
's to 0. - This is a projection, and there's multiple types, like orthographic.
Don't worry about the details. Just note that our projection will be setting all
World space is a place where our artists can build their worlds. Notice though that:
- Vertices are anything, they are any
. - Pixel coordinates must instead be in $0 \leq x_p \leq \text{width} - 1 (and similar for
). - We need some bounds. Starting at
in the bottom-left, we need the maximum, top right corner so we don't write outside the pixel space.
- We need some bounds. Starting at
So the big thing you have to do here is: make a transformation from our 3D space of
Since our pixel space will have to, eventually, cut off items in our world space. In a similar way, us as programmers can cut off items themselves in the world space.
Conflicts in Seeing the Items
Notice that, if we see two items, we need to consider the order that we render objects. We won't solve this yet, but keep it in mind.
Rasterizer Overview (How to Build)
Thus, for our P1 rasterizer, we need to:
- Read in our
objfile to get vertices in world coordinates. - Convert the world to pixel coordinates (will set boundaries in the world based on window size)
- Do a depth test to only write the
's in the front - We only have the vertices colored in! So color the bounding triangle (ie: rasterize the triangle) and decide which pixels to color in.
The big question is 4. How do we decide the pixel to color in?
Line Rasterization
One of the early algorithms was line rasterization. Notice that there's 3 lines per triangle. You've seen the equation as
Note that usually
Consider the barycentric coordinates:
where
This seems confusing, but look at this worksheet:
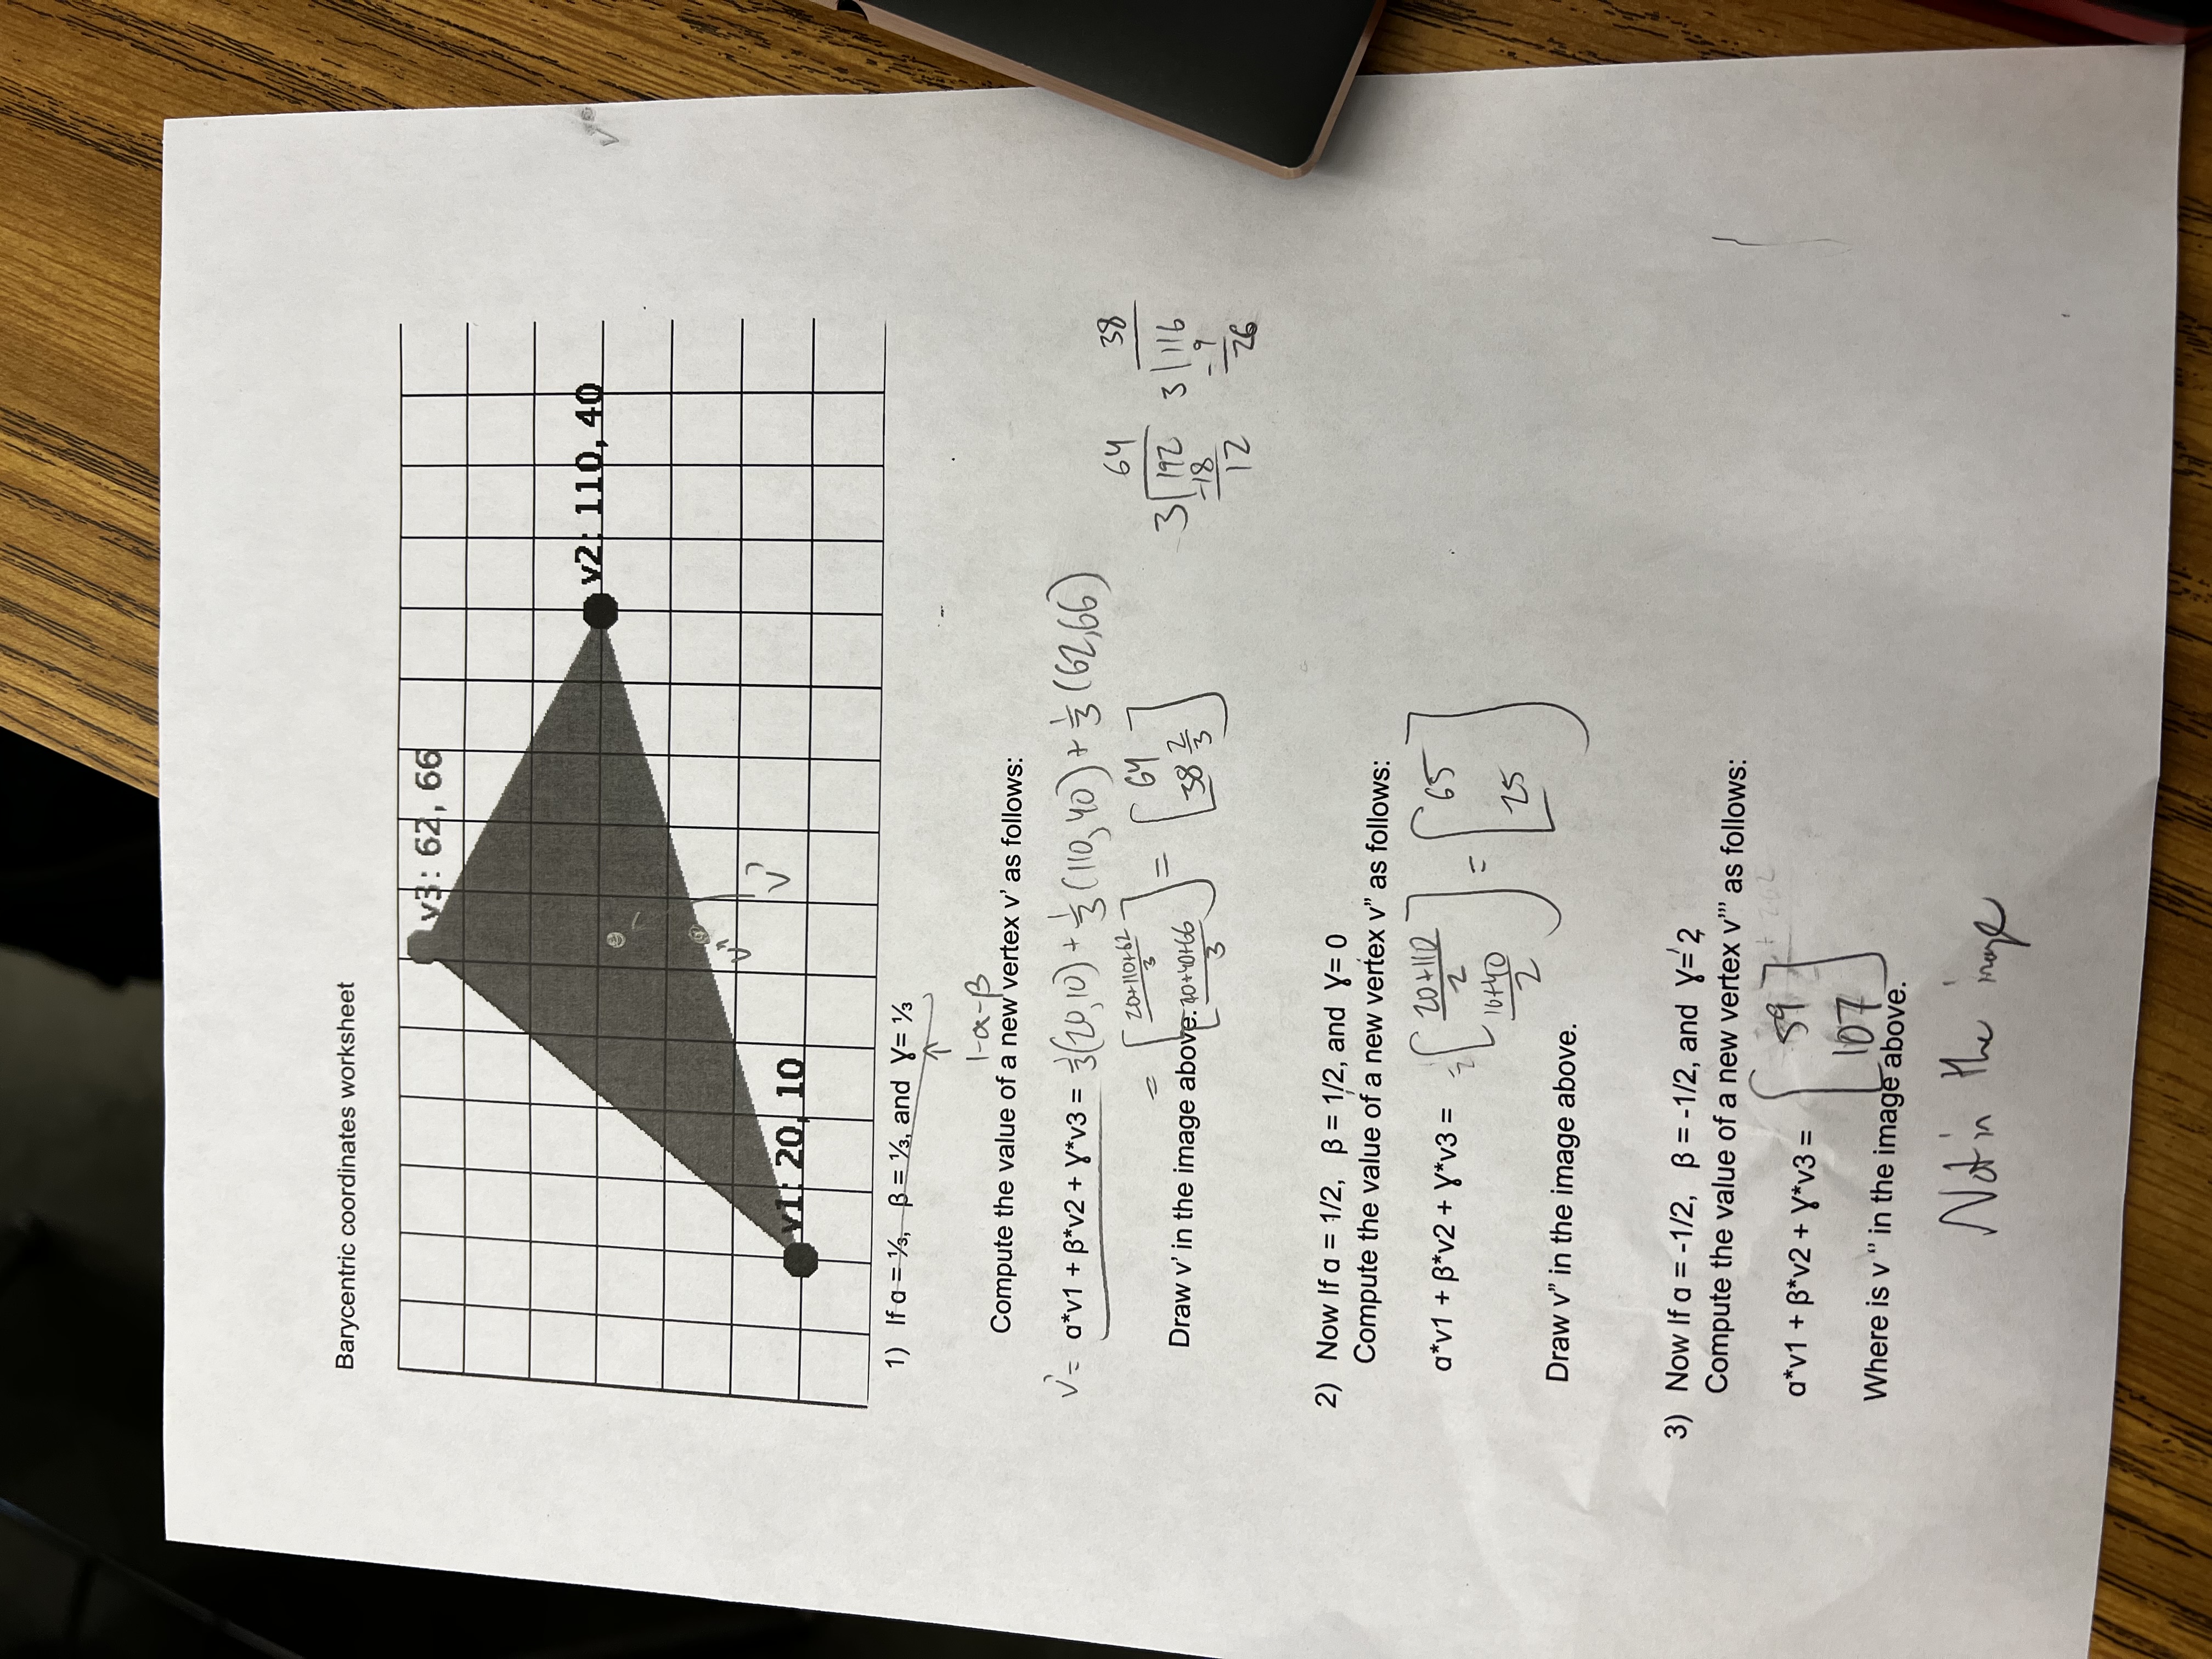
The idea here is that if
But what if we go backwards? Given a pixel coordinate, can we solve for
Therefore: the idea here is:
- Get the bounding box for the triangle (from Lab 1)
- Determine the values of
for each pixel. If , (and similar for ), then draw the point (the appropriate color)
We can use these as well to color the pixels based on the colors of our triangle's vertices, and then use
More on Barycentric Coordinate Intuition
The way to think about this is that the areas of the triangles opposite to the point in question are the proporitions of
So then:
Recall from Linear Analysis I that, if you have two edges
Know that the determinant is needed here:
So the process is:
So:
- Computer
, the area of this big - For every pixel in bounding box of this triangle, compute
. Repeat for the other coefficients ( ). For the latter, we can just do . - If all coefficients are between 0 and 1, use the coefficients to draw our weight colors.